.svg)
Prylada Server
Central panel for remote configuration and unified management of IoT devices included in your asset monitoring system.
Request a demo
Why do you need the Prylada Server?
The primary function of the Prylada Server is to centrally administer a vast array of Prylada or third-party IoT devices, including gateways, transmitters, and beacons. With the server, you don’t need to manually check the battery level, operating status, and firmware version in all connected devices. The opportunity of remote configuration, automatic firmware updates, and clear visualization makes critical asset monitoring a straightforward and well-coordinated process, with cost-saving potential.

Configure, monitor, and support all connected IoT devices without the need for on-premises presence.

Make informed decisions based on the data insights derived from remote asset monitoring.

Aggregate all data from your assets in one place with secure role-based access to it.

Ensure your asset data is transferred and stored according to the latest security standards.

Gain full observability of your critical assets with a single intuitive interface.
Transfer data from your assets to any third-party management system for unified control and more extensive analysis.
Modular architecture of the Prylada Server
The server typically includes three modules given below, but can be extended for additional opportunities by your request.

Analytics and visualization module
Extracts valuable information from unstructured data and reacts according to predefined scenarios. Also, provides a user interface for telemetry visualization and device troubleshooting.

Integration module
Provides a simple solution for integration with client’s data collection, analysis, and management tools.

Infrastructure module
Enables remote device configuration, over-the-air (OTA) firmware updates, and configuration of various system components. It offers universal configuration options for sensors and gateways, serving as a central control hub for all infrastructure-related operations. This module is also responsible for data security.
Admin panel - Your command center
The Prylada Admin Panel is a web-based interface that puts complete control of your IoT infrastructure at your fingertips. Whether you're deploying environmental sensors, asset trackers, or custom monitoring solutions, the Admin Panel provides intuitive tools for configuration, real-time monitoring, and data analysis.
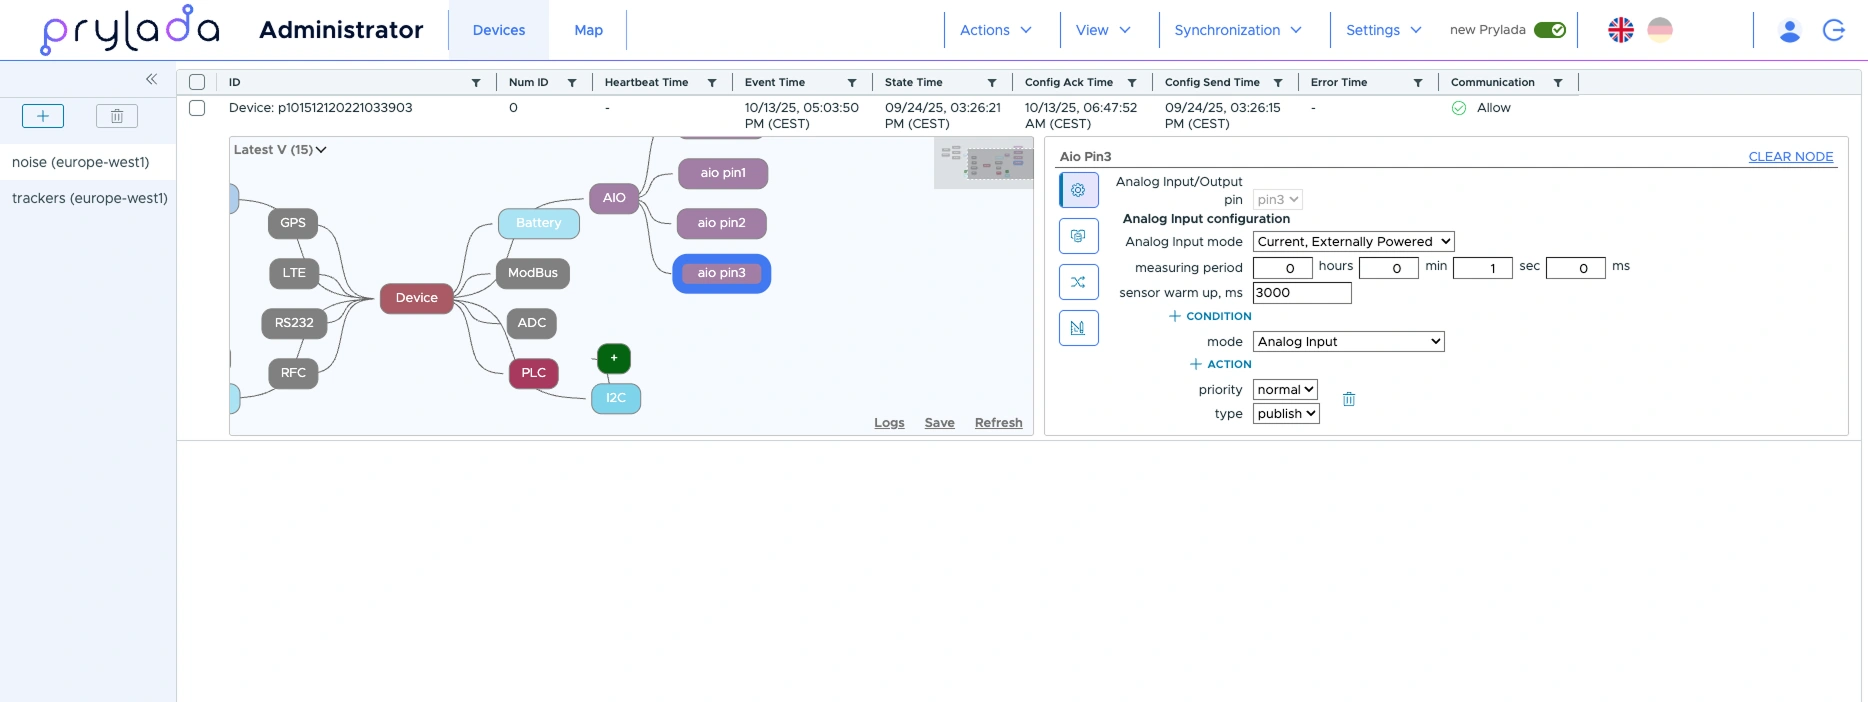
Navigate your entire IoT ecosystem through an interactive visual map. Each device, sensor, and gateway is represented with clear connection relationships, making it easy to understand your network topology at a glance.

The visual interface shows all connected components (GPS, LTE, ModBus, RS232, ADC, PLC, I2C) with real-time status indicators. Click any element to configure its parameters instantly.
Manage multiple sensors from a single interface. Configure current-powered sensors with external power options:
Set up:
- Individual sensor warm-up times (up to 30 seconds)
- Analog input modes tailored to each sensor type
- Conditional triggers for automated actions
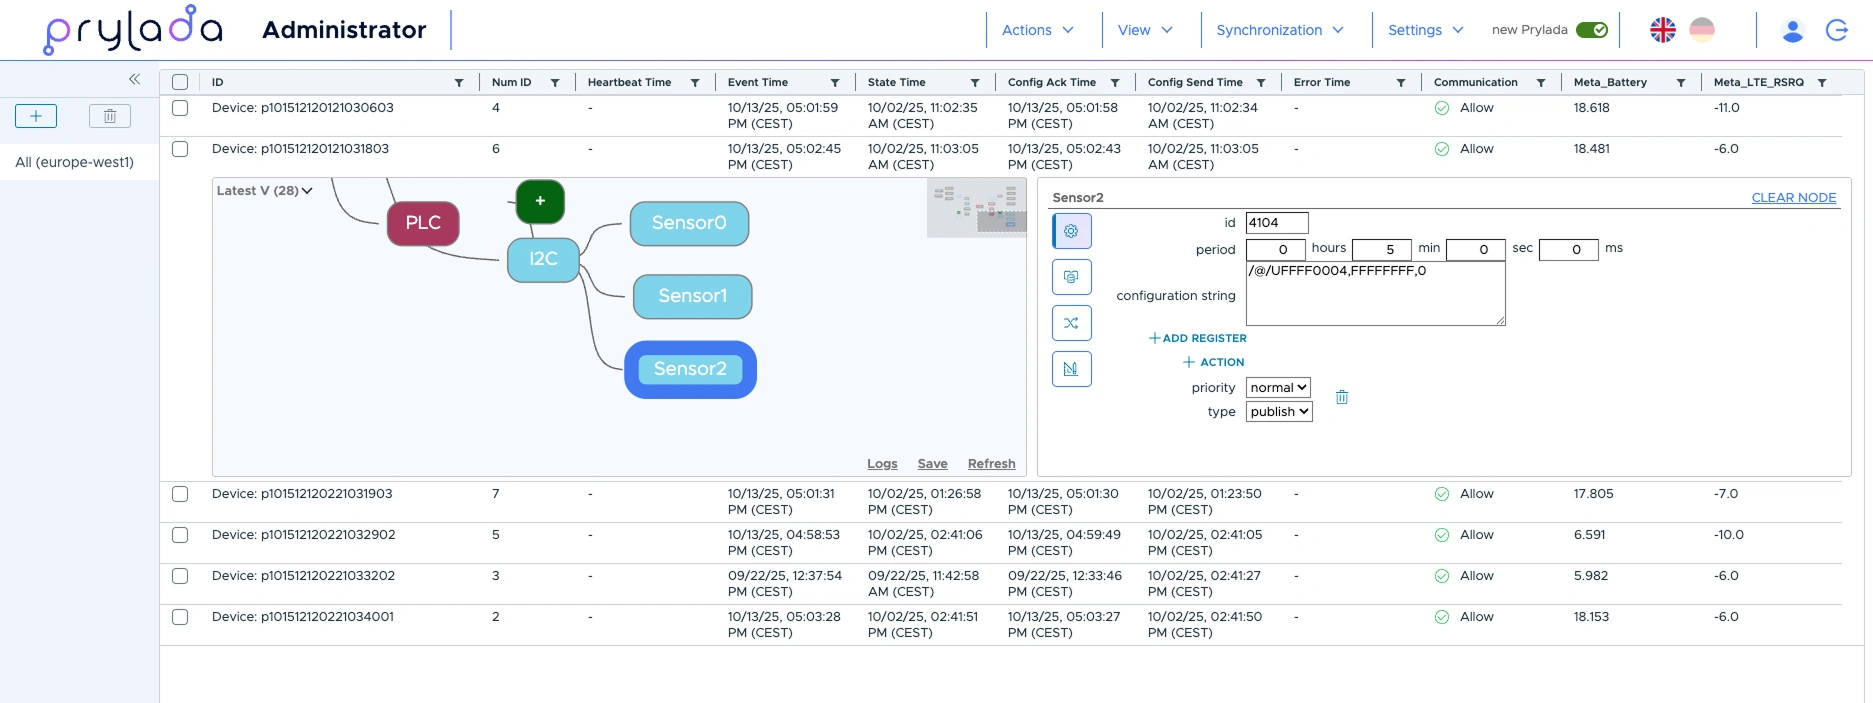
Manage complex sensor networks through an intuitive visual interface:
See the complete signal flow from sensors (aio pin1, pin2, pin3) through communication layers (ModBus, ADC, PLC) to connectivity modules (Battery, I2C, Sensor0-2). The simplified view helps you quickly identify connections and troubleshoot issues.
Access complete device profiles with firmware details, network parameters, and custom metadata:

Each device profile includes:
- Battery status and device type
- Firmware versions for BUS, CORE, ModBoot, and RF components
- LTE signal parameters (RSRP, RSRO)
- Custom configuration strings
- Sensor identifiers and network settings
Optimize battery life with intelligent power management settings:

Choose between:
- No Power Management — continuous operation
- Soft Power Management — balanced performance
- Max Power Management — extended battery life
Fine-tune measuring periods (hours, minutes, seconds) to match your application requirements.
Configure analog inputs with precision for voltage, current, thermocouple, and resistance measurements:

- Voltage, Current, and Resistance measurements
- Thermocouple support for temperature monitoring
- Customizable measuring periods and sensor warm-up times
- Conditional logic for automated responses
Operating principle
The Prylada Server receives and processes telemetry, metadata, system log, and device state from the IoT infrastructure in real-time. Depending on the monitoring environment, you can observe this data, as well as configure and manage the devices, from a web, desktop, or mobile application. This becomes possible due to the opportunity of running the server on the Prylada Cloud, a private cloud, or on-premises.
.webp)

Ask for module specifications
Leave us your email, and we will reach out to you to provide with all the necessary information
Features
Configure and manage thousands of hard-to-reach IoT devices from a remote control panel. You can connect both the Prylada devices and any third-party IoT assets.
Use remote firmware updates and battery checks to optimize maintenance time and resources.
Create, manage, and execute different operating scenarios using the power of programmable logical controllers.
Easily access your server account and other services you are registered in with a single set of credentials.
Connect and configure new devices in minutes whenever you need to expand your monitoring system.
Bring more efficiency into the work of your technicians with an easy-to-learn and quick-to-navigate custom dashboards.
Available license options
Custom licensing agreements
Hybrid licensing
Perpetual license (including OEM options)
Usage-based pricing (subscription)